)
In today's world, everyone produces vast amounts of data every day - these data streams can quickly become overwhelming. The question is always which data is actually useful. To not only survive in this sea of data as an online retailer, but also to be successful, you need precise and actionable insights. Shopify Analytics helps you turn the flood of business data into clear, actionable insights and enables you to make informed decisions to maximize your sales, for example.
In this blog post, we’ll introduce you to the powerful features and benefits of Shopify Analytics and show you what’s new in the tool with the Spring Editions 2026.
In a nutshell: What is Shopify Analytics? Shopify Analytics is Shopify’s built-in, free analytics tool. It tracks all key e-commerce metrics (revenue, conversion rate, traffic, and orders) directly at the source in the store’s backend—without any complex setup or unreliable tracking scripts. The tool provides online retailers with precise, real-time data that serves as a reliable basis for decision-making when optimizing their stores.
Table of contents
- Shopify Analytics at a Glance: How It Works, Benefits, and Pricing Plans
- What's new in Shopify Analytics with the Spring Editions 2026?
- What advantages does Shopify Analytics offer?
- How does the connection of a store to the tool work?
- What functions does Shopify Analytics offer?
- Reports with Shopify Analytics
- Benefits of store data analysis - these are the insights retailers can gain
- The most important key figures: These KPI's belong in your analytics dashboard
- Shopify Analytics vs Google Analytics - What's the difference?
- Exkurses: Why not all figures are meaningful
- Conclusion
Do you need support with your Shopify store? As Shopify Plus experts, we will be happy to assist you and help you customize your store to your requirements. Get in touch with us.
Shopify Analytics at a Glance: How It Works, Benefits, and Pricing Plans
As a native control center, Shopify Analytics processes all store activities right where they occur. The tool provides a reliable technical foundation for deriving concrete actions for your online store from raw metrics.
Native Tracking vs. External Analytics Tools The key advantage of Shopify Analytics lies in its deep system integration. While external tracking tools typically collect user data via front-end scripts in the browser—and are therefore vulnerable to ad blockers, cookie restrictions, or script errors—Shopify Analytics collects transaction and visitor data directly in the server backend.
Feature Set by Shopify Plan The tool is active from day one on every plan without any technical setup required. The feature set scales with your store’s needs:
Basic & Shopify: Offer immediate access to the core live dashboards, real-time views, and essential standard reports on revenue, traffic, and customers.
Advanced Shopify & Shopify Plus: Unlock advanced analytics tools—including custom reports (via ShopifyQL), in-depth cohort and RFM analyses, and specialized B2B and bundle reporting.
Why Shopify Analytics Is Indispensable for E-Commerce Businesses
In today’s e-commerce landscape, gut feelings and vague assumptions are no longer enough to survive in the market. Given rising customer acquisition costs and intense competition, the targeted analysis of your store data directly determines your margins and scalability. Shopify Analytics transforms complex data streams into clear, actionable insights without any additional setup effort. This gives you the transparency you need to make sound strategic decisions, avoid bad investments, and put your online store on a data-driven path to growth.
Make data-driven decisions: Regular Shopify store analysis prevents you from investing resources in unprofitable initiatives.
Identify sales potential: Find out which products sell best and which are frequently abandoned in the shopping cart.
Allocate marketing budgets more efficiently: By seeing where your highest-spending visitors come from, you can direct your budget toward the most lucrative channels.
Better understand customer behavior: Understand your customers’ journey through the store to minimize friction points.
Reading tip: Read this article to find out when you should switch to Shopify Plus.
What's new in Shopify Analytics with the Spring Editions 2026?
With the Spring Editions 2026, Shopify Analytics continues to enhance its reporting capabilities: Merchants not only receive more data, but also more context about what’s changing in their store, why metrics are shifting, and what actions they can take as a result.
Automatic Insights:
Shopify Analytics now displays automatically detected trends directly on the dashboard. To do this, it analyzes sales, session, and fulfillment data, among other metrics. The tool highlights notable trends or changes and directs merchants straight to the relevant report. This allows merchants to identify relevant trends more quickly without having to manually sift through numerous reports.
Annotations for More Context:
Another new feature is annotations directly within Analytics charts. These mark relevant events in the store—such as product launches, theme changes, or app installations. This will help merchants in the future to correlate changes in revenue, sessions, or other metrics with specific store activities.
Metafields and Metaobjects as Analysis Dimensions:
Analytics can now also use information from Shopify metafields and metaobjects for analysis. Merchants can use their individual product or customer data as dimensions and filters in reports. This enables significantly more specific analyses that are better suited to the individual data structure.
Analytics Data in Shopify Flow:
Particularly useful for automation: Shopify Flow can retrieve analytics data via ShopifyQL using the new “Get analytics data” action. The results can then serve as the basis for conditions and further actions in a workflow. For example, automatic notifications can be triggered when specific sales figures or other metrics reach a defined value.
Marketing Data Directly in Analytics:
Shopify is bringing marketing data and store performance closer together. Metrics such as ad spend, ROAS, impressions, and sessions can now be viewed alongside sales data in Analytics. This allows for a more comprehensive analysis of marketing activities and their impact on store performance.
New Visualizations Make Complex Relationships Visible
Shopify is also expanding Analytics with new options for visualizing data. These include scatter plots, bubble charts, radar charts, and sunburst charts. Additionally, multiple metrics can be displayed together in specific line and bar charts. This makes it easier for merchants to identify relationships, distributions, and trends.
What advantages does Shopify Analytics offer?
Shopify Analytics offers some specific advantages over traditional analytics tools such as Google Analytics. One of the most important advantages is the integration of the tool into your Shopify store: The Shopify Analytics tool is directly integrated into the Shopify dashboard, which gives you a seamless user experience. This also means that there are no additional costs for using the tool. Traditional analytics tools such as Google Analytics 4 (GA4), on the other hand, often require setup and integration into your website.
Reading tip: How to connect Shopify and Google Analytics 4 (GA4).
As with any analysis, data quality is also crucial in e-commerce. Shopify Analytics collects data directly from your Shopify store - so it's always accurate and up-to-date. In addition, the tool is specifically tailored to the needs of online retailers and offers reports that directly cover relevant e-commerce metrics such as sales, order volume or conversion rates. GA4 is a general analysis tool and therefore requires more extensive customization to create similar e-commerce reports.
Shopify's in-house analysis tool is also particularly user-friendly - even for users without in-depth technical knowledge. All dashboards and reports are immediately understandable and do not require extensive training. With other store systems based on more complex platforms such as Adobe Commerce (formerly Magento), the learning curve can be much steeper and deeper technical knowledge is often required to collect and analyze similar data.
Reading tip: Find out more about the differences between the two platforms in our Magento vs Shopify comparison.
 The analytics features are integrated directly into the Shopify platform and draw on the store data available there.
Reading tip: Find out how WooCommerce vs Shopify differ and which platform is the right choice for you.
Overall, the Shopify Analytics tool allows you to analyze your store performance more efficiently and securely without the need for in-depth technical knowledge.
How does the connection of a store to the tool work?
In principle, you do not need to take any additional steps to be able to use Shopify Analytics. The connection is made automatically when you set up your Shopify store. As soon as your store is live, Shopify Analytics immediately starts collecting data and displaying it in user-friendly dashboards and reports.
If you need more advanced analytics, Shopify offers advanced features that are included in higher plans such as Advanced Shopify and Shopify Plus. Here you can create custom reports and customize specific metrics according to your needs without the need for additional integration. If you need additional customization or advanced features, you can also integrate one of the many Shopify analytics apps from the Shopify App Store.
What functions does Shopify Analytics offer?
The Shopify Analytics tool offers you many powerful functions that have been specially developed for the needs of online merchants.
The most important functions include detailed reports on sales, order volumes, conversion rates and average order values. These help you to constantly monitor the performance of your store. Essentially, Shopify's analytics and reporting features help you improve your marketing strategy, optimize your store layout and better understand your audience.
Dashboard
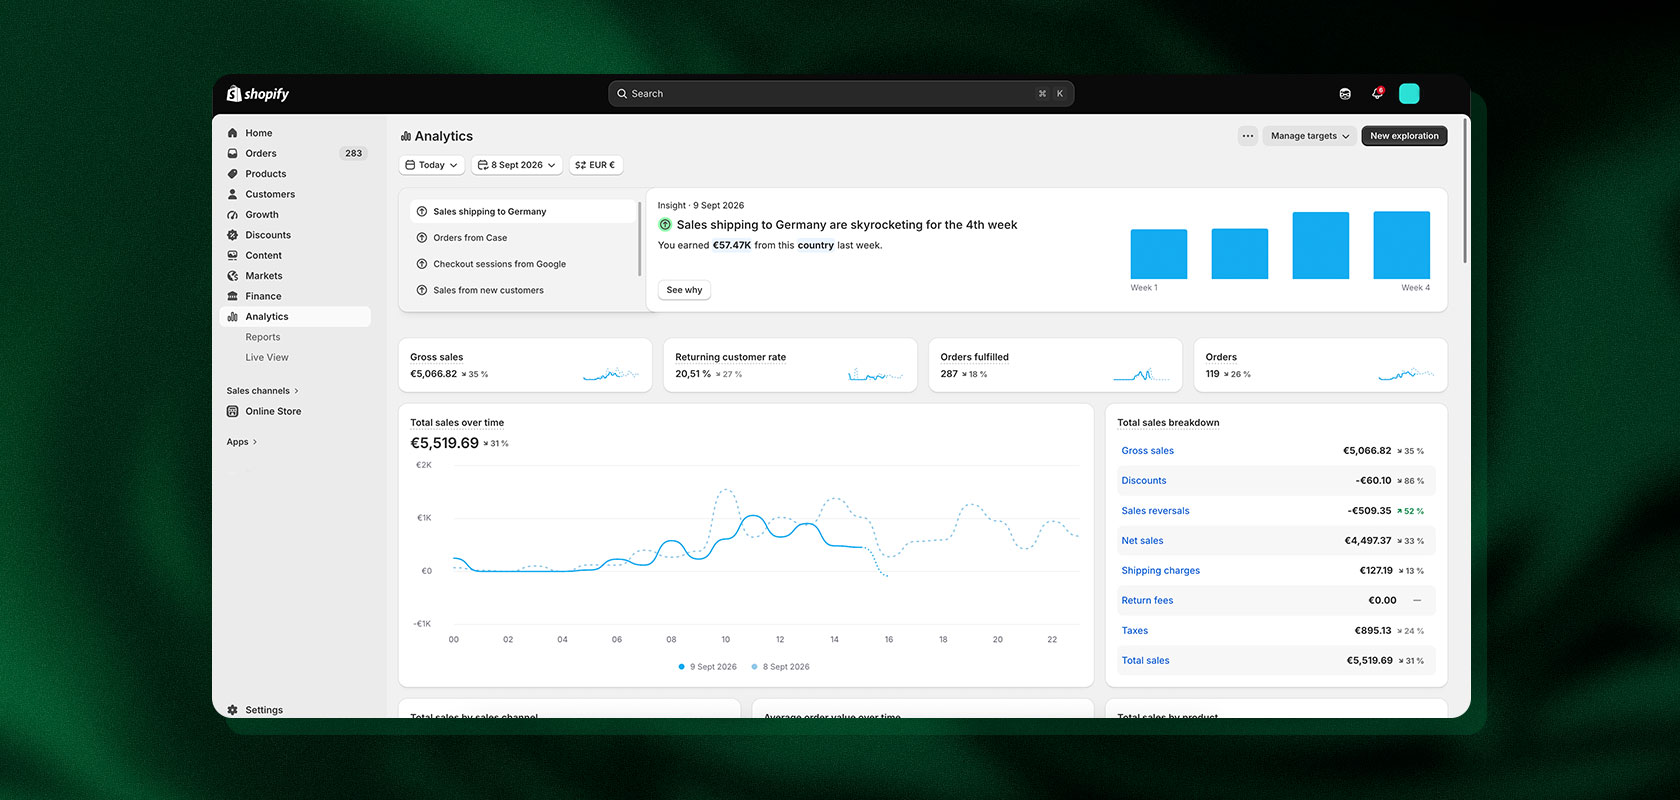 Shopify's user-friendly Shopify Analytics Dashboard gives you a quick overview of the most important key performance indicators (KPIs) in your store in real time. The dashboard shows you in seconds how your store is currently performing and where there is potential for optimization.
Detailed reports and analyses
In addition, Shopify Analytics Reports allow you to create customized reports combining various metrics such as sales, sessions and conversion rates to gain deeper insights into your business operations. These features are designed to help you make informed decisions and continuously optimize your business strategy.
These include:
Sales reports: these help you to find out which items are selling well and which are selling less, so you can adjust stock levels and marketing strategies accordingly.
Customer reports: Find out who your best customers are. You can also gain insight into their buying habits and return rates to develop an effective customer retention strategy.
Traffic and acquisition reports: With this data, you can better understand where your visitors are coming from and how they interact with your website. This allows you to optimize your marketing efforts.
Behavioral reports: Learn how customers interact with your store and identify areas for improvement in navigation.
Live View
The live overview in the dashboard enables merchants to gain and analyze real-time insights into visitor behavior in their Shopify store.
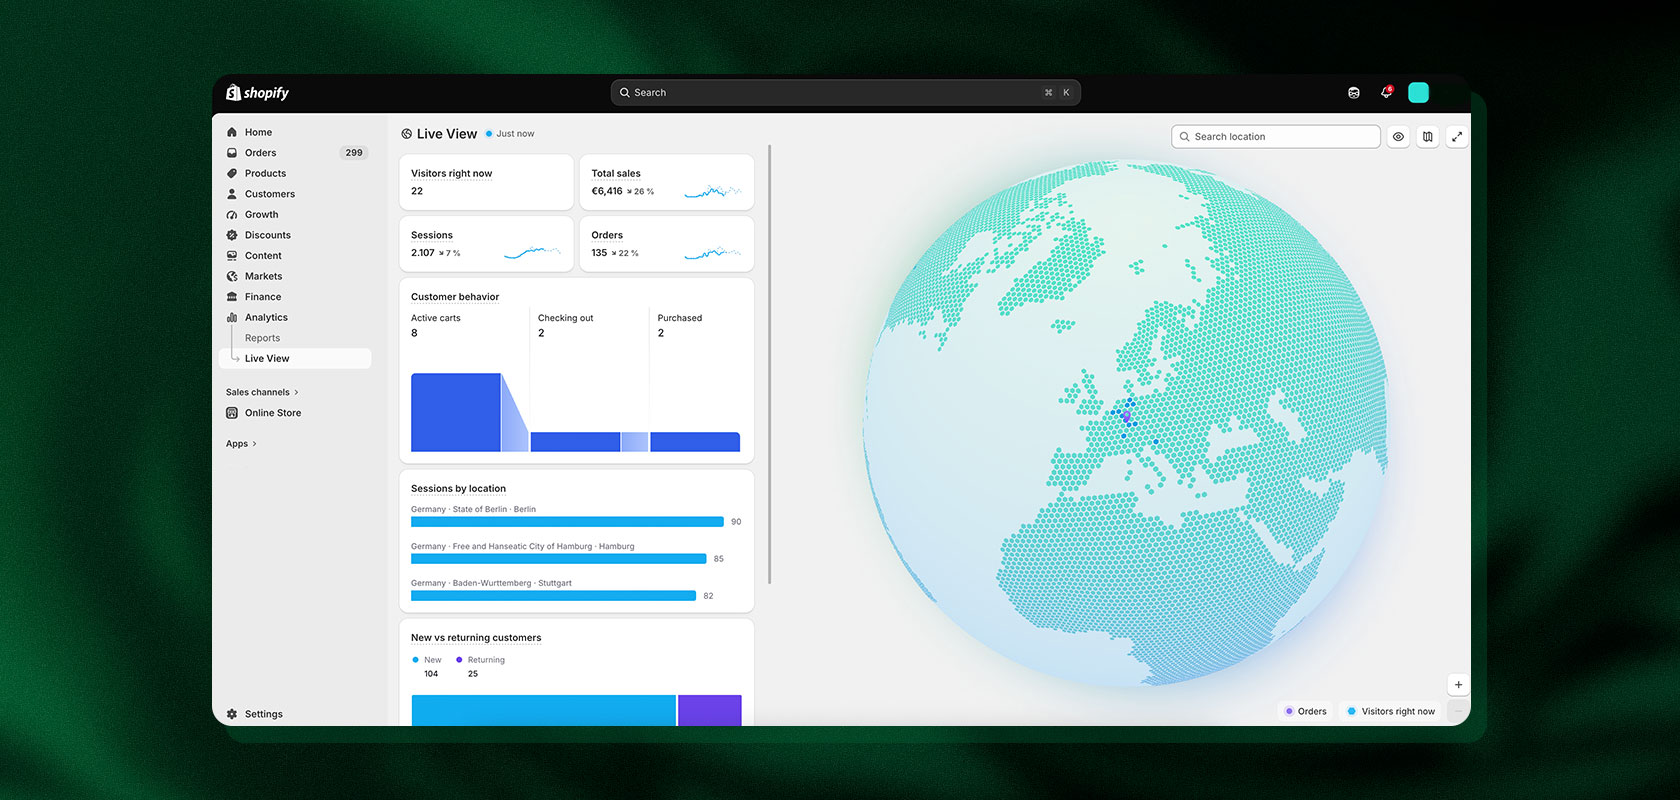 Live View shows on a world map and a globe where the activities in your store originate and provides important key figures on current events.
You can use it to monitor activity and sales in your online store in real time, especially during busy periods such as Black Friday or after new marketing campaigns.
Reports with Shopify Analytics
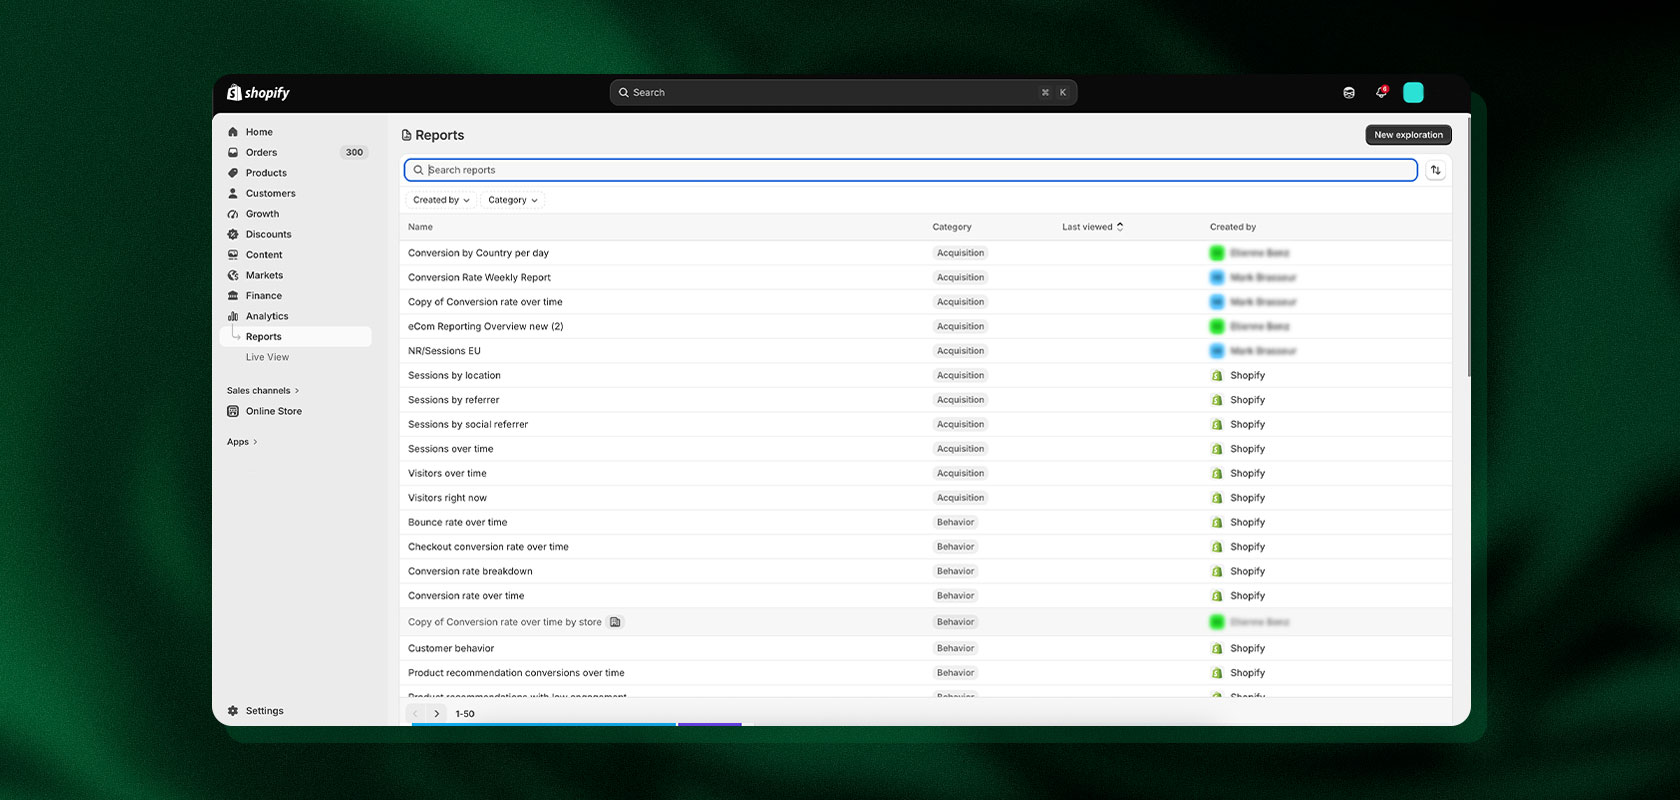 With Shopify Analytics, all key figures can be displayed as visual tiles in the statistics overview. The dashboard can be freely designed so that key figures can be added or removed at any time.
Shopify Analytics offers a range of standard reports, e.g. Sessions by referrer, Sessions overtime, Top online store searches and many more. These help merchants to gain insights into their business data. The standard reports are divided into the following categories:
Acquisition
Orders
Fraud
Retail sales
Financials
Profit
Inventory
Customers
Marketing
Behavior
Sales
Reports on product bundles
The reports available to you here will depend on your chosen Shopify plan.
Reading tip: You can find an overview of Shopify prices in this article.
With Shopify Winter Editions '25, Shopify also introduced the RFM (Recency, Frequency, Monetary Value) analysis report. This RFM analysis report evaluates customers based on three criteria:
Recency: When did the customer last purchase?
Frequency (frequency of purchase): How often does the customer buy?
Monetary Value (amount spent): How much does the customer spend in total?
With the help of this analysis, retailers can divide their customers into different segments (e.g. “top customers”, “sleeping customers”, “occasional buyers”). Based on this, targeted marketing campaigns can be created, e.g:
Discounts for inactive customers to win them back
Exclusive offers for top customers to keep them loyal
Automated email campaigns for different types of customers
Advanced Analytics: Cohorts and Bundles
Another powerful report is the Customer Cohort Analysis. It allows you to accurately measure customer retention by analyzing repurchase rates and understanding the long-term revenue trends of specific user groups (cohorts). For retailers who offer product bundles, Bundle Analytics is extremely helpful, as it allows you to measure the revenue generated by product bundles and directly compare their performance to that of individual products.
Shopify also allows users to create custom reports by performing specific data queries using the ShopifyQL query language. This allows them to extract exactly the information they need for their analysis, such as sales by product category, average basket value by advertising channel or customer activity by region. Filters and dimensions can be added to segment the data according to specific criteria. This can help to understand specific target groups or behavior patterns in more detail.
Benefits of store data analysis - these are the insights retailers can gain
Store data analysis offers retailers numerous benefits that help them optimize their business and better serve their customers. Here are some of the key benefits and insights that retailers can gain by analyzing their store data:
Understanding customer behavior: by analyzing shopping data, retailers can understand which products are being purchased, when and how often. They can identify different customer groups and create targeted marketing campaigns for each group.
Price optimization: Retailers can adjust prices in real time based on demand, competitor prices and other factors. Analyzing the impact of discounts and promotions helps to develop the most profitable pricing strategies.
Improving marketing: By analysing customer preferences and behaviour, retailers can develop personalized marketing campaigns. The effectiveness of marketing campaigns can be measured and analyzed to improve future strategies.
Customer satisfaction and loyalty: Customer ratings and comments can be analyzed to identify and eliminate weaknesses in customer service. Customers can be addressed and supported individually, which increases customer satisfaction and loyalty.
Improving the shopping experience: Analyzing the checkout abandonment rate can help to identify and eliminate obstacles. Website navigation and user experience can be improved based on customer interactions.
Product development: Helps to understand which products or services are well received by customers and develop new offers accordingly. As a retailer, you can also understand which products are not selling, monitor them for a while and, if necessary, remove them from your stock completely.
Resource utilization: By optimizing inventory levels and operating costs, retailers can reduce their expenses.
Strategic decisions: Identify new market trends and new business opportunities through long-term data analysis. Comparing your own performance with that of your competitors helps you to identify strengths and weaknesses.
The most important key figures: These KPI's belong in your analytics dashboard
By comprehensively analyzing store performance, you can identify strengths and weaknesses, which helps to continuously improve the customer experience and increase the conversion rate. It also allows you to monitor business goals and increase competitiveness through data-based adjustments. We will show you which key figures you should always keep an eye on:
Revenue
Revenue is probably one of the most fundamental and important key figures. After all, it provides information about the store's total revenue over a certain period of time. Sales growth shows the change in sales compared to the same period in the previous year or the previous months.
Conversion rate
 The conversion rate indicates how many visitors to the store actually become paying customers. It shows the ratio of the number of purchases to the number of visitors to the store and is an important indicator of the effectiveness of the store in converting visitors into buyers.
Traffic and sources
These metrics show where the store's visitors come from (e.g. organic search, paid advertising, social media) and how much traffic the store generates. This helps to evaluate the effectiveness of different marketing channels and optimize resources accordingly.
Orders and average order value
These metrics indicate the number of orders and their average value. They help to understand how much customers spend on average per purchase and can provide insights into cross-selling and upselling opportunities.
Shopping cart abandonment
 The cart abandonment rate shows the percentage of customers who started the checkout process but did not complete the purchase. A high abandonment rate can indicate problems in the checkout process, high shipping costs or other obstacles that prevent customers from making a purchase.
Best-selling products
This metric provides insight into the current needs of customers. These insights can be used to react quickly and actively to trends. Opportunities for cross-selling or upselling can also emerge here.
Returning customers
The number of returning customers shows whether customers are satisfied with the online store, the brand and the product range. A high rate therefore indicates strong customer loyalty and customer retention.
Shopify Analytics vs Google Analytics - What's the difference?
Shopify Analytics and Google Analytics are both powerful tools for data analysis, but they take different approaches. Shopify Analytics is specially optimized for Shopify and offers key figures such as sales, conversion rate or average order value directly in the dashboard. It is easy to use, but provides less in-depth insights into user behavior.
Google Analytics, on the other hand, offers more comprehensive data analysis across different channels, including detailed user paths, traffic sources and behavioral patterns. However, it requires a more complex setup and interpretation of the data. Ideally, both tools should be used together: Shopify Analytics for quick store insights and Google Analytics for in-depth analysis to optimize the customer journey.
This also highlights the limitations of Shopify Analytics: When it comes to in-depth cross-channel tracking models, complex attribution across different devices, or visual customer journey analyses, the Shopify backend alone is often not enough. This is where GA4 or additional BI tools really shine.
Exkurses: Why not all figures are meaningful
Not all figures are meaningful, as their interpretation and meaning depend heavily on context, data quality and analytical methods. It always makes sense to integrate additional analysis software such as Google Analytics (GA4) in order to gain even deeper, non-product-related insights. For in-depth data analysis, the use of third-party software or specific methods such as cohort analysis is recommended to ensure long-term success in e-commerce. Software such as Mouseflow or Inspectlet can help you to understand how customers move around your online store.
Without context and attribution, isolated figures such as conversion rate can be misleading. It's crucial to understand the reasons behind the numbers and look at the data in context to gain truly valuable insights.
Here are some reasons why numbers can sometimes be misleading or not meaningful:
Lack of context: Figures without context provide little insight. Sales growth of 10% sounds good, but if the industry is growing by 20% on average, that's not impressive.
Quality of data: Incorrect, incomplete or outdated data can lead to false conclusions. If data is collected improperly or biased, it may not reflect reality.
Statistical distortions: Single extreme values can distort the average or other statistical measures. Small samples can also lead to unreliable results that are not representative.
Scope for interpretation: Figures can be interpreted in different ways. What is a positive development for one analyst could be a warning for another. Biased interpretations and presentations of the data can lead to misleading conclusions.
Data without a recommendation for action: Figures are only valuable if they lead to concrete actions or decisions. Pure figures without interpretation and context are often of little use. Data that cannot be applied to specific business processes or decision-making is often meaningless.
Temporal dimension: Individual figures at a specific point in time do not provide any information about trends or developments over time. Time-delayed data can misrepresent current trends or conditions.
Conclusion
Shopify Analytics is an indispensable tool for online merchants who want to effectively monitor their store performance. It helps you filter relevant information and turn it into actionable insights. Its seamless integration with the Shopify dashboard, user-friendly interface and reports tailored specifically for e-commerce make it a powerful solution suitable for both small and large businesses.
If you need help using Shopify Analytics or customizing your Shopify store, we are happy to assist you as Shopify Plus experts. Contact us today to find out more.
Frequently asked questions about Shopify Analytics
What is Shopify Analytics?
Shopify Analytics is a tool from Shopify that allows you to analyze various aspects of your store performance. It provides insights into sales figures, visitor data, product performance and more.
What does Shopify Analytics cost?
Shopify Analytics is a tool from Shopify that allows you to analyze various aspects of your store performance. It provides insights into sales figures, visitor data, product performance and mor
How can I access Shopify Analytics?
To access Shopify Analytics, navigate to the Analytics menu item in the Shopify Dashboard. Here you can access various reports and data visualizations that give you insights into your store performance.
Which Shopify plans include analytics features?
In general, every Shopify plan offers access to Shopify Analytics. However, the complexity and depth of the available reports increase with higher-tier plans (such as Advanced Shopify or Shopify Plus), which also provide merchants with custom reports.
What reports are available in Shopify Analytics?
There are numerous standard reports organized into categories such as Acquisition, Orders, Finance, Inventory, Customers, Marketing, and Sales. Available reports include RFM, cohort, and bundle analyses, among others. The specific reports available depend on your Shopify plan and the corresponding analytics features.
What is the difference between Shopify Analytics and GA4?
Shopify Analytics collects data (such as revenue, orders, and inventory) directly and accurately from the store’s backend. Google Analytics 4 (GA4), on the other hand, focuses more on detailed front-end user behavior, in-depth traffic acquisition, and complex, cross-channel customer journeys. For a comprehensive data picture, both tools should be used in combination.
What's new in Shopify Analytics with the Spring Editions 2026?
With the Spring Editions 2026, Shopify has introduced, among other things, automatic insights, annotations, metric targets, new data visualizations, and filtering options based on meta fields and meta objects. Analytics data can also be used for automations via Shopify Flow.
